Period comparison
This month vs. last month, this year vs. last year, topic by topic.
Compare your rating, response rate and net sentiment with the anonymous average of businesses like yours. Any of the industry's common complaints that also show up at yours get flagged.
On Pro and above · Included in the trial
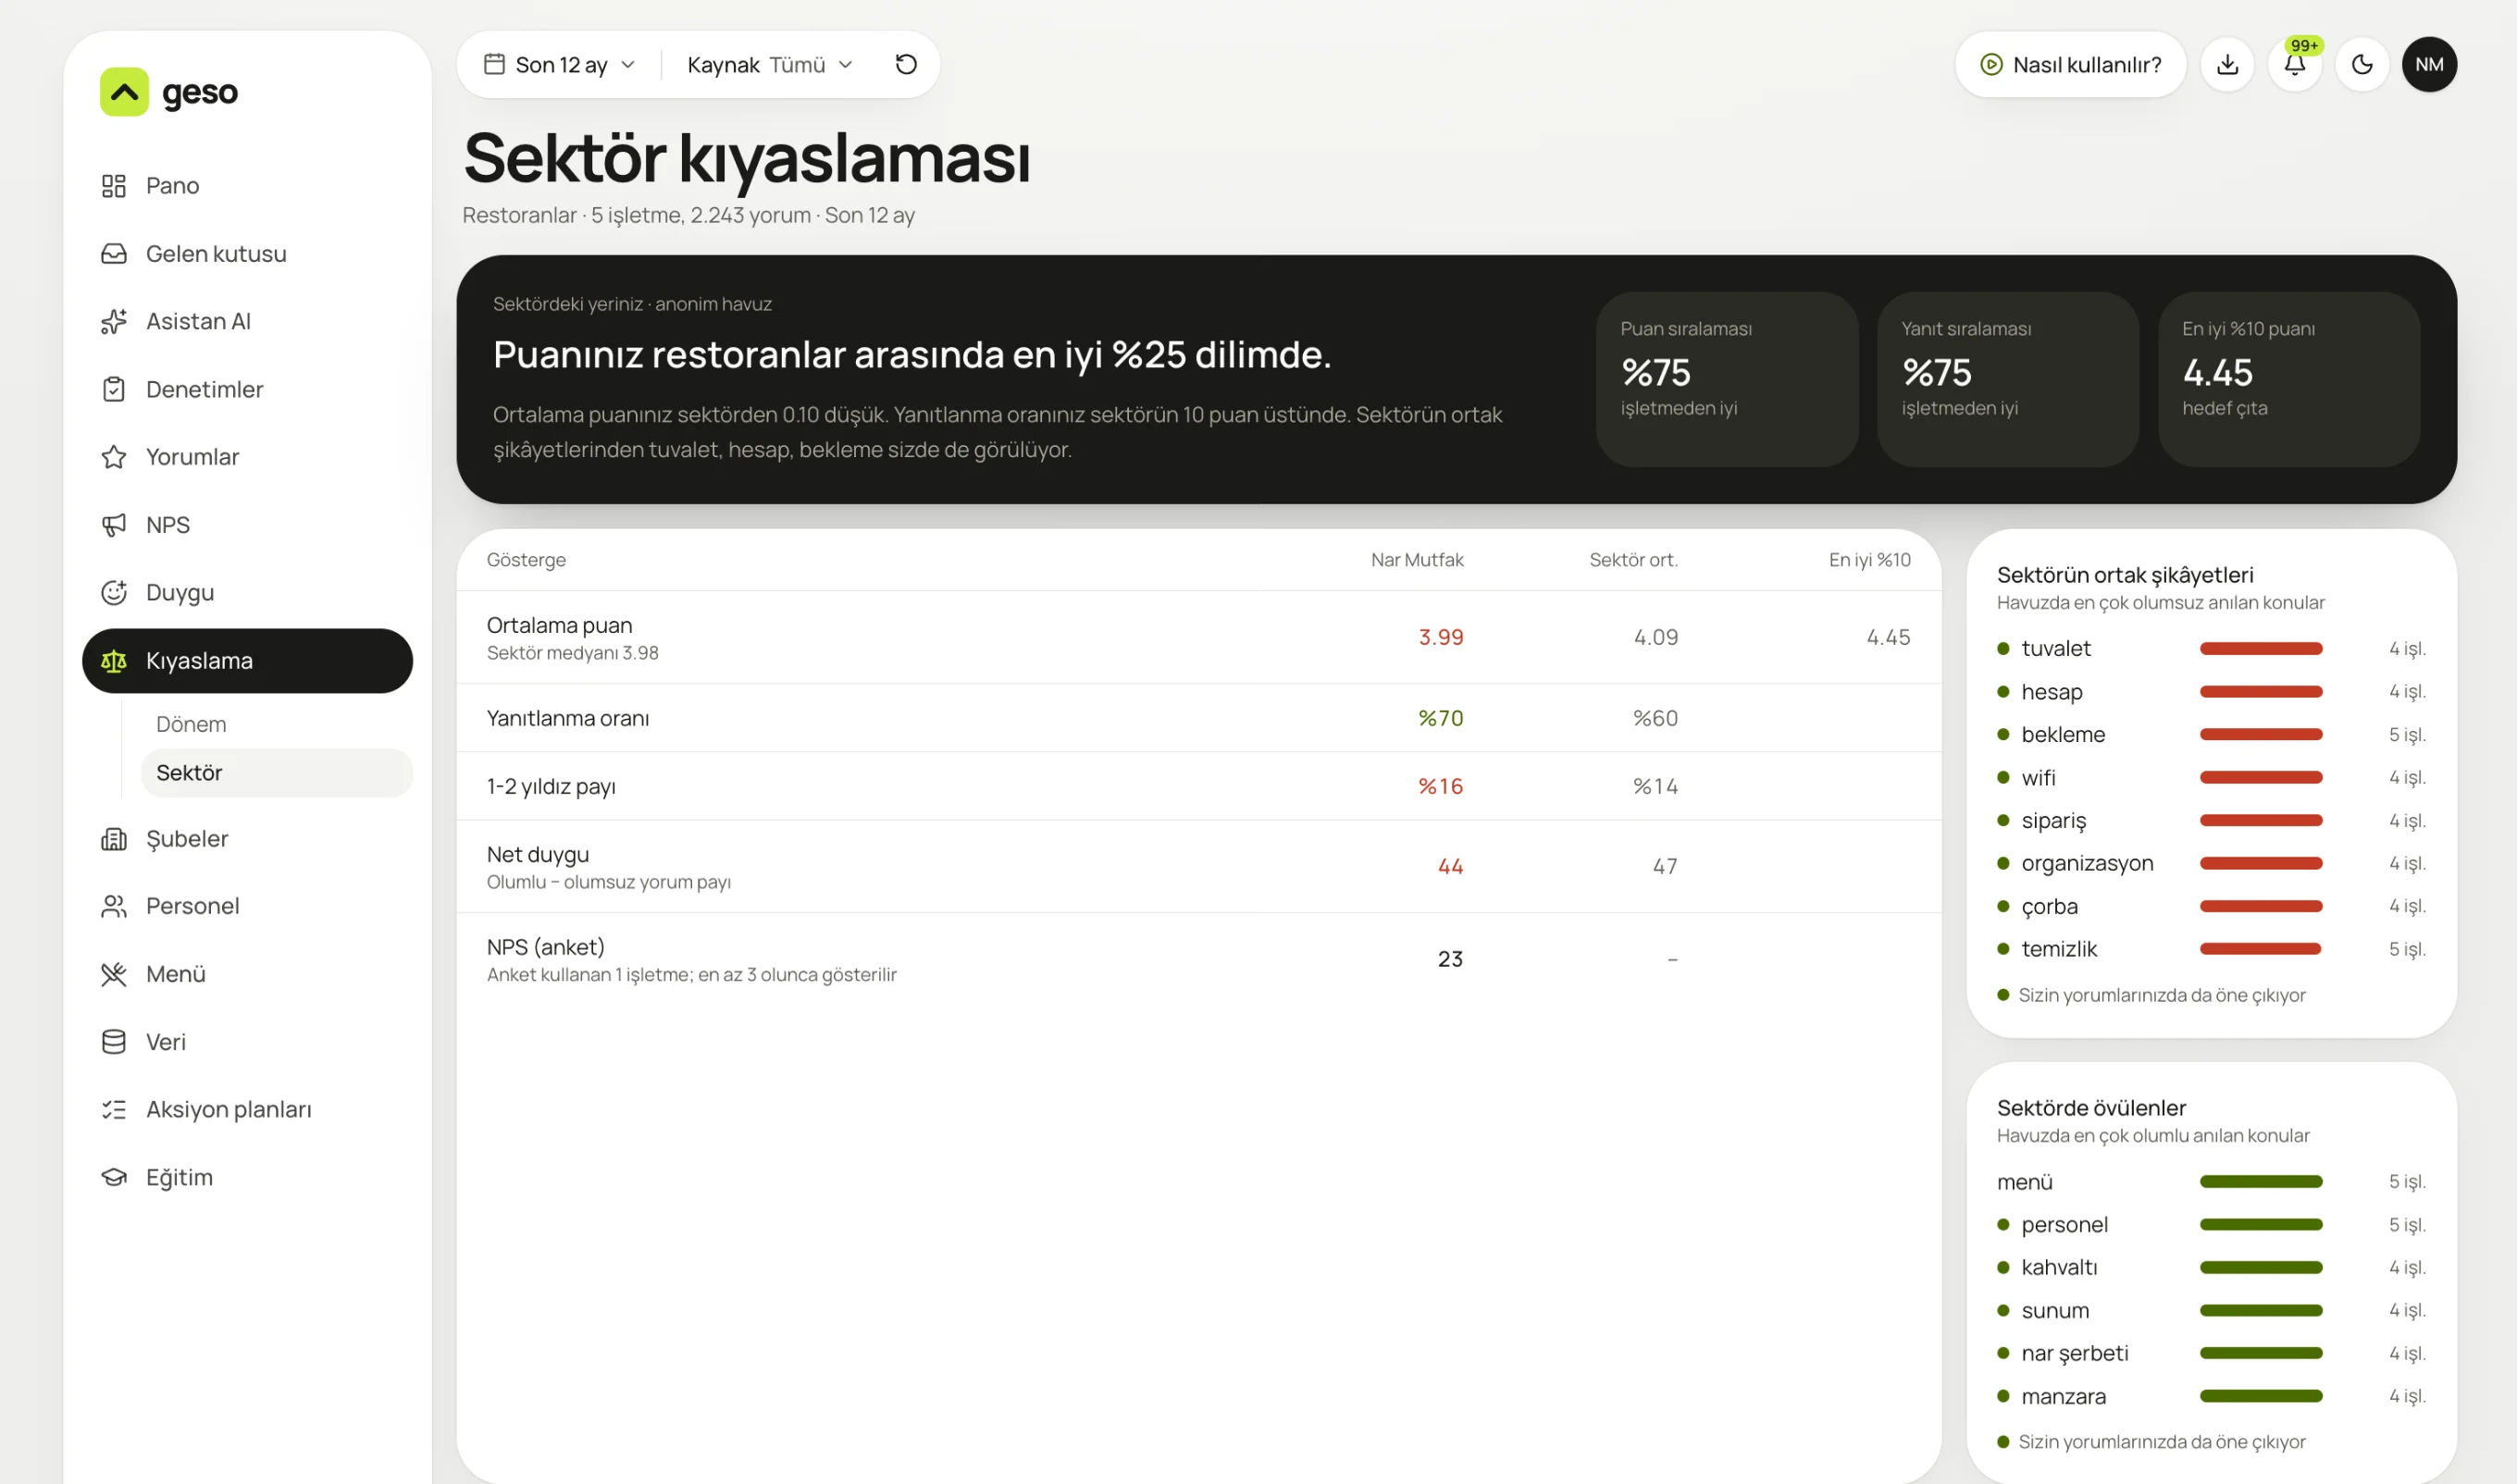
Real panel screen. The sample business “Nar Mutfak” and its data are for demo purposes.
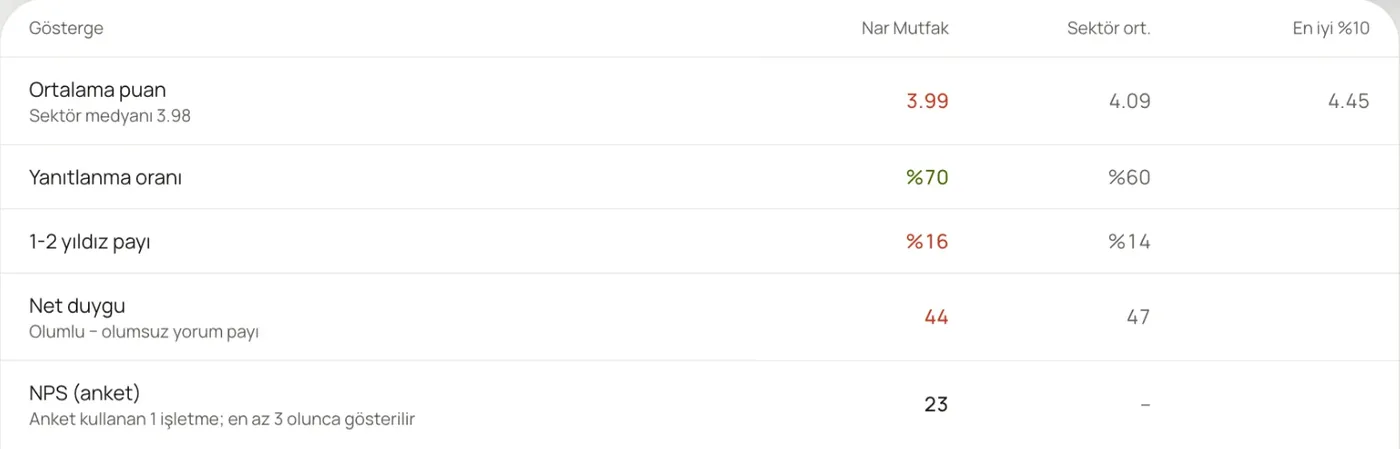
Average rating 3.99 vs. 4.09 for the industry; response rate 70% vs. 60%.
Understand whether your rating is good or bad compared with similar businesses. Separate industry-wide problems from the ones that are yours.
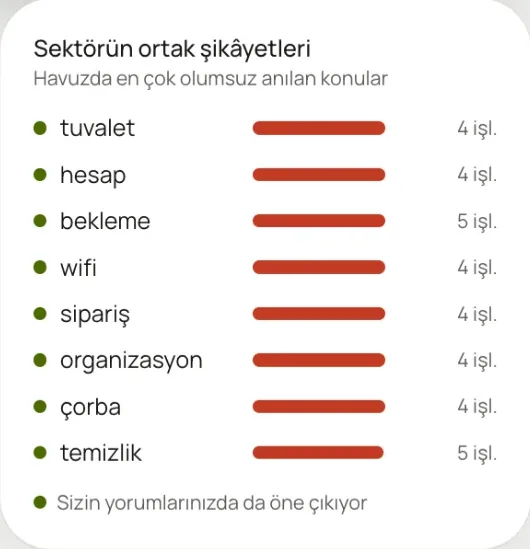
Restrooms, the bill, waiting: common across the industry too. The ones that show up at yours are flagged.
This month vs. last month, this year vs. last year, topic by topic.
An anonymous pool of at least three businesses: the average, the top 10% and common complaints.
Rating, response rate and NPS side by side, location by location.
All your businesses, sorted by what needs attention.
Region filters and regional manager access (Enterprise).
The pool is anonymous. No other business's name or reviews are ever shown.
No. The industry pool is anonymous and opt-in; only aggregate averages are shared.
An industry average for a metric only appears once at least 3 businesses have data for it.
Pro includes 3 locations, each extra location is $59 a month; Enterprise has unlimited locations and regions.
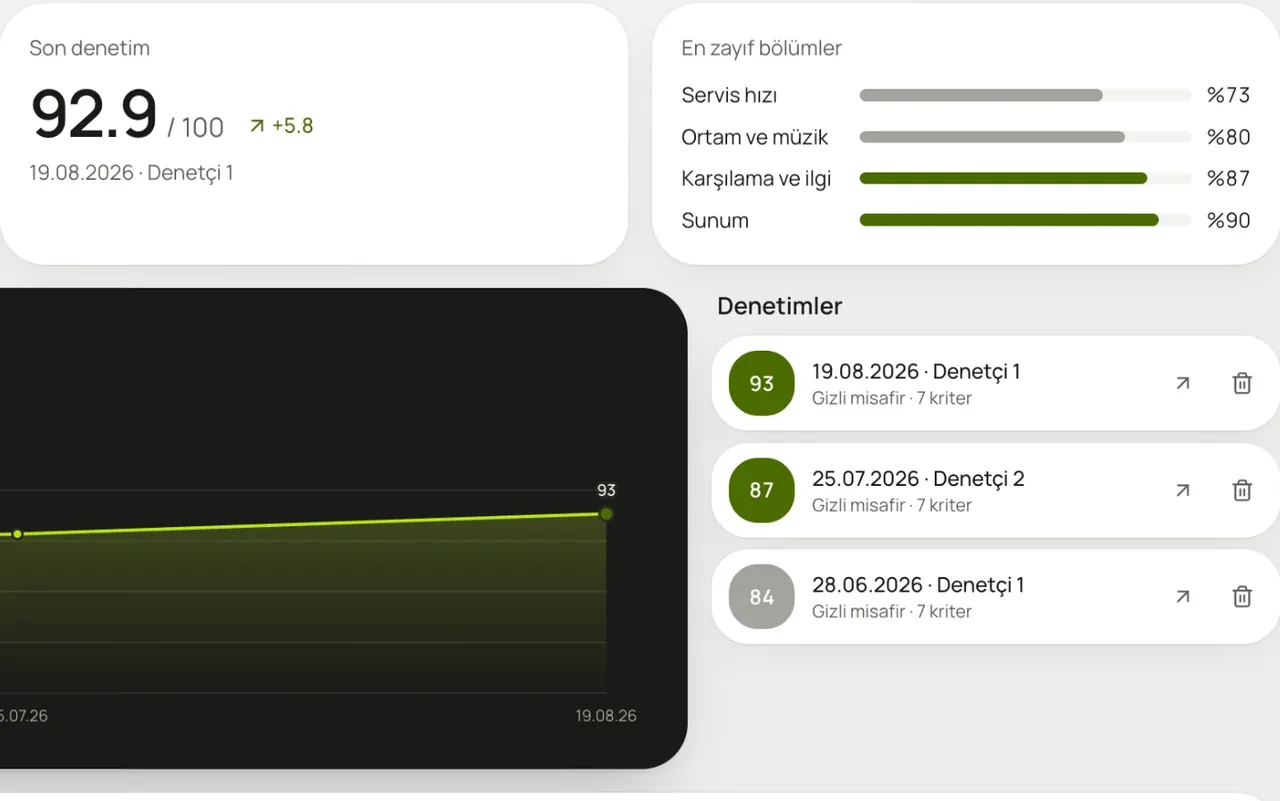
Assign an auditor and they fill in the form on their phone. The score and weakest section land on your dashboard.
Learn more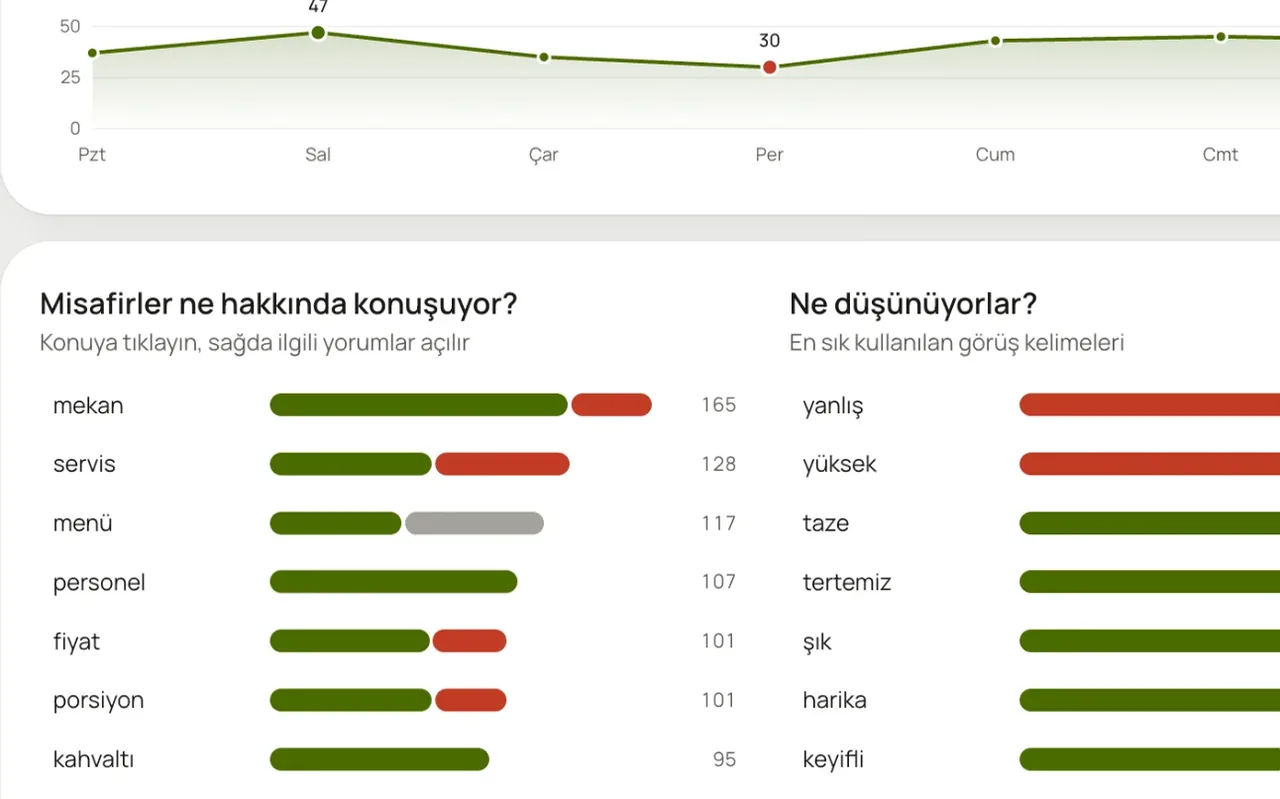
What are guests talking about, and is it good or bad? Topic by topic, day by day.
Learn more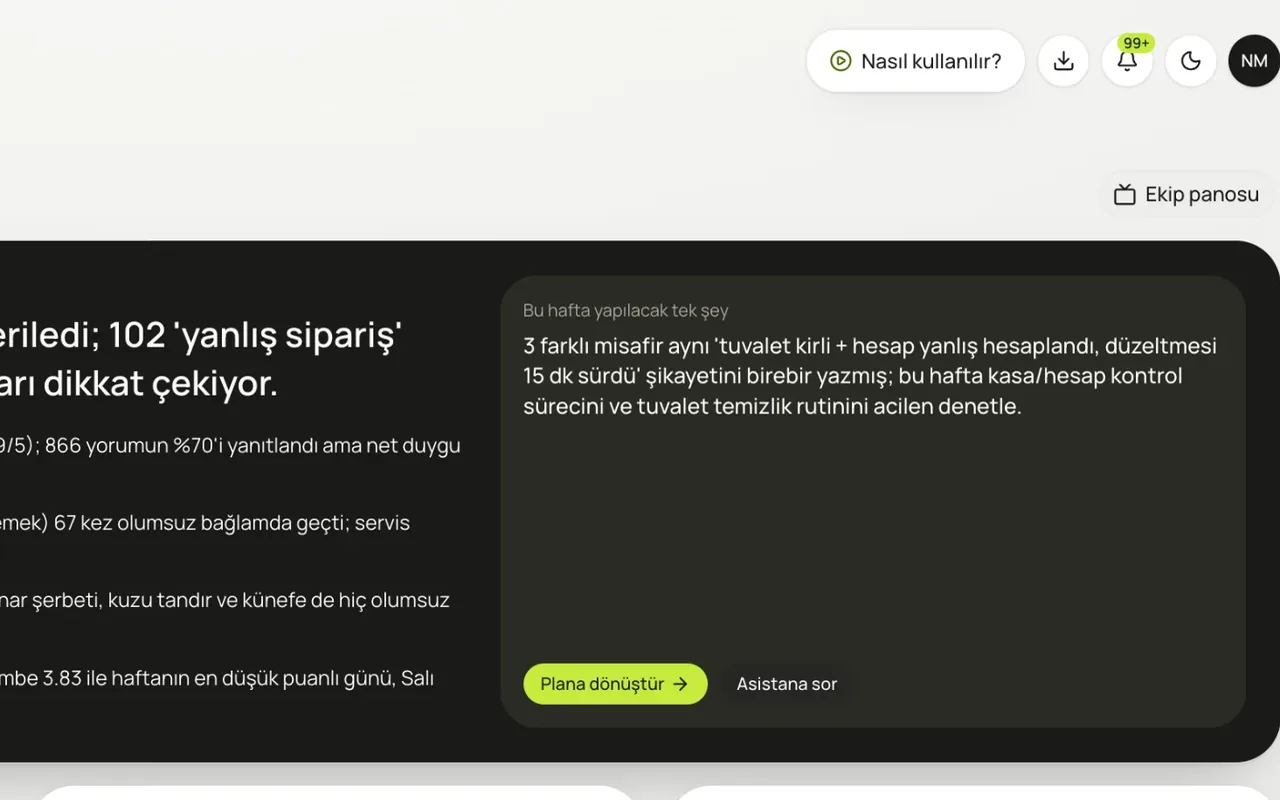
Low-rating alerts, a Monday report, a team board on the kitchen screen, and CSV export.
Learn moreIn a 20-minute demo, we load your Google reviews and look at what the assistant says, together.
No card required · 10-minute setup · Cancel anytime